Unravelling the Molecular Complexity of Venom Glands
Venom glands contain a complex mixture of bioactive molecules, many of which are being studied across different research groups at the University of Queensland. Many different and complimentary techniques are important for these studies, in recent years the use of Mass Spectrometry Imaging (MSI) has been included to add critical information about where particular analytes exist in the tissue sample. Figure 1 shows the workflow typically employed.
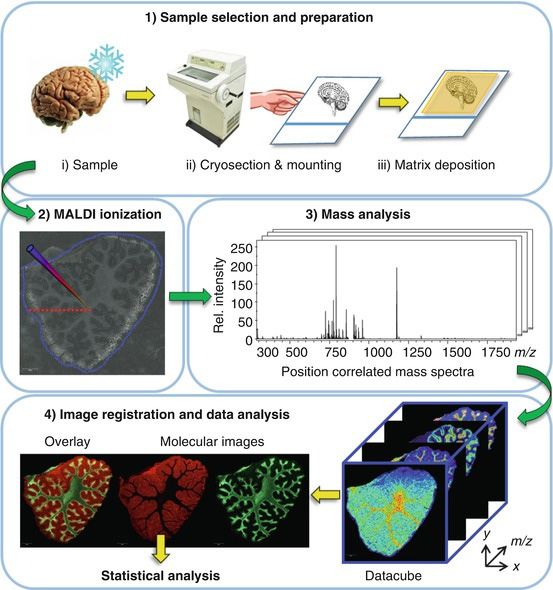
Figure 1. B.A. Boughton and B. Hamilton 2017; Chapter 12 "Spatial Metabolite Profiling by Matrix-Assisted Laser Desorption Ionization Mass Spectrometry Imaging"; in "Metabolomics: From Fundamentals to Clinical Applications, Advances in Experimental Medicine and Biology" Springer International Publishing AG, DOI 10.1007/978-3-319-47656-8_1
There have been several examples of application of Mass Spectrometry Imaging to various aspects of projects involving venomous animals.
Project 1
Renan Castro Santana, a PhD student of Assoc Prof Bryan Fry was interested to study the regeneration of venom in the glands of Phlogius Crassipes (Tarantula) from Cape York (Olkola). For this study, animals were depleted of venom and the MSI undertaken at different time points post venom deployment. Using sublimed 2,5-Dihydroxybenzoic Acid, and a Bruker Ultraflex III MALDI-TOF/TOF, MSI analysis was undertaken with 40 µm lateral resolution. Positionally correlated analyte distributions showed the location of the venom components in the gland, in the context of the morphology of the tissue section from the Tarantula. Figure 2 shows typical analyte distributions observed during this project.
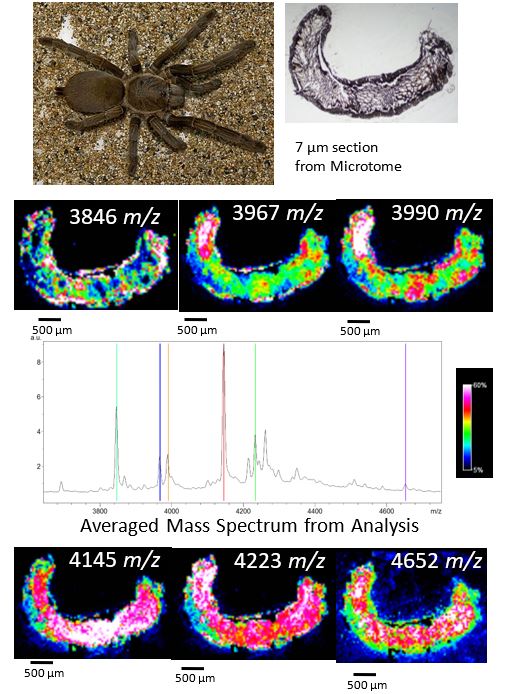
Figure 2. Phlogius Crassipes (Tarantula), a 7 µm histological section of the venom gland, and several analyte distributions observed during MSI analysis.
Project 2
Mass Spectrometry Imaging has been applied to observing the spatial distribution of many analytes, and this next project undertaken by Brett R. Hamilton, David Marshall, Nicholas R. Casewell, Robert Harrison, Stephen Blanksby, Eivind Undheim, investigated the potential of MSI to map the existence of biological processes. In a nutshell, we were able to show the presence of enzymes on the tissue surface by monitoring the product of specific enzymatic products after the application of substrates of the enzyme – a process we refer to as functional mass spectrometry imaging (fMSI). Figure 3 shows the process of fMSI in a pictorial form.
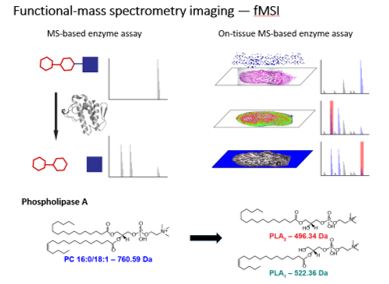
Figure 3. fMSI imaging workflow – shown for phospholipiase A2.
Specifically during this project, we utilised venom glands from the brown forest cobra (Naja subfulva), due to the known high levels of phospholipase A2 (PLA2) enzymes, which hydrolyse the ester bond at the sn-2 position from a phosphatidylcholine (PC). We showed the PLA2 hydrolysis for a number of PC molecules by N. subfulva venom in the solution phase, using electrospray and matrix assisted laser desorption ionisation (MALDI) mass spectrometry. The assay was then converted into an imaging mass spectrometry method, by developing PC deposition protocols followed by matrix deposition to allow for MALDI MSI to be undertaken using a Bruker Autoflex Speed MALDI-TOF and AP-MALDI-QqTOF mass spectrometer. Figure 4 shows the enzymatic cleavage of phosphatidylcholine on the surface of a histological section of a N. subfulva venom gland.
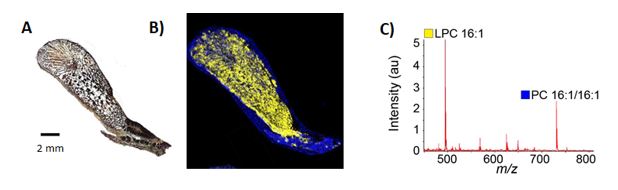
Figure 4. fMSI of N. subfulva venom gland, showing the distribution of PLA2 activity against PC16:1/16:1. (A) Optical image of a 7 µm section of venom gland tissue, (B) MALDI-MSI ion map s of the substrate (blue) and PLA2 product (yellow), and (C) averaged MALDI mass spectrum showing PC 16:1/16:1 substrate and the PLA2 product LPC 16:1.
Final proof of principle came from laser capture microdissection (LMD) of discrete regions of tissue from N. subfulva, these regions were tested for PLA2 activity by mixing with PC and then analysed by bottom up proteomics using an ABSCIEX 6600 mass spectrometer. The results from these LMD regions proved enzyme activity in the sample when the extract was exposed to PC, and the presence of PLA2 by analysis as a bottom up proteomics experiment.
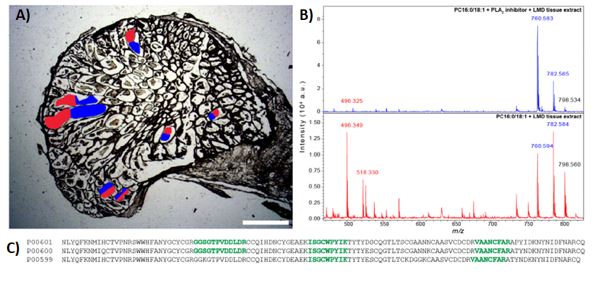
Figure 4. A) Leica LMD-7 microdissection the contents within the ductules of a subsequent venom gland section. 2 equal groups were collected (red or blue). B) Each of the two groups of micro-sections were pooled and then incubated with PC 18:1/16:0, with (top) or without (bottom) 500 µM Varespladib (inhibitor of PLA2). The presence of inhibitor revealed complete inhibition of the PLA2, showing the LPC production was due to the presence of active PLA2 in the venom gland. C) Bottom up proteomics was used to confirm the presence of PLA2 in the Varespladib inhibited tissue extract, confirming PLA2 from the species complex of N. subfulva. UniprotKB accession numbers are given for each PLA2, while amino acid sequence regions corresponding to high-confidence matches in our analysed tryptic digest are shown in bold green.
The fMSI approach has the potential to become a generalizable workflow that can be used to monitor other enzymatic and physiological processes in-situ. fMSI will yield more insight into enzymology, and the roles of enzymes in health and disease. The work has been published in Angewandte Chemie (https://doi.org/10.1002/ange.201911390).